Stability
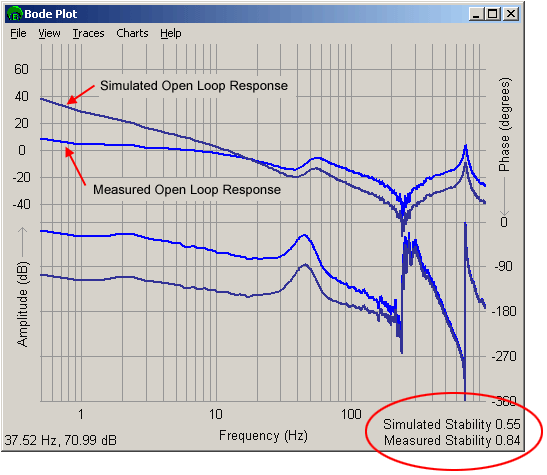
A quantitative stability measurement is made when a bode test
is run. The measurement is displayed quantitatively in the bottom right hand
corner of the plotting window. The stability measurement is performed on both
the measured (as you ran the test) open loop and the simulated (simulated response
based on current tuning) open loop response. Keep in mind that the measured
and simulated response are identical if you have not changed the control tuning
since taking the measurement. When simulating control loop response, you can
compare the stability of the measured vs. simulated response.
Stability Method (Traces -> Stability -> Stability)
Light blue - Measured open loop response
Dark
blue - Simulated open loop response
A visual representation of the measurement is shown in the
Nyquist plot when the Stability trace is shown. To show the Nyquist plot,
make sure Traces -> Nyquist is checked. To see the stability measurement, make
sure the Traces ->Stability is checked. The stability measurement is shown as
a black arrow. The measured and simulated response will have separate arrows
for their corresponding stability measurements (if different).
The length of the arrow is equal to the stability measurement
value in the lower right of the plotting window.
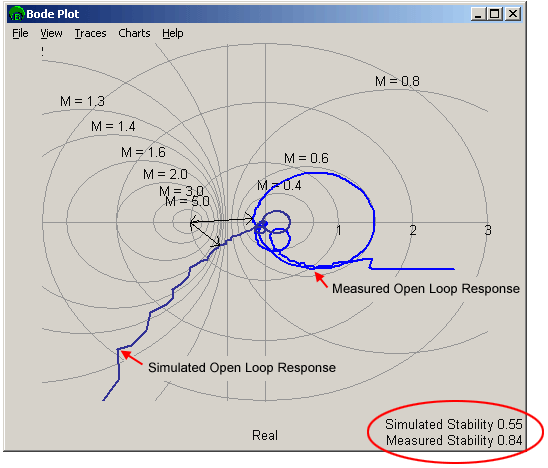
Light blue - Measured open loop response
Dark
blue - Simulated open loop response
The stability measurement is the distance between 0 dB, -180
degrees and the closest open loop response point. The 0 dB, -180 degree point
represents an oscillator. In the example above, the stability measurement is
0.63.
The stability value ranges from 0 on up (x > 0).
However, a realistic upper limit value of 1 would be normal. A stability measurement
of 0 would represent an extremely unstable system. A stability measurement of
1 would represent an extremely stable system. It is not uncommon for customers
to end up with a stability figure in the range of 0.3 - 0.5 after all tuning
if finalized.
NOTE: The stability measurement is calculated off of
the nearest open loop response point. No interpolation between points is performed
for this measurement.
Gain and Phase Margin Method
(Traces -> Stability -> Gain / Phase
Margin)
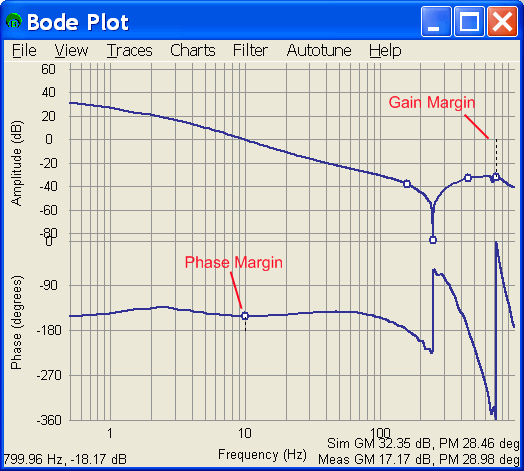
The gain and phase margins are commonly used in controls to
quantitatively determine how stable a system is. The gain and phase margin are
separate measures of the stability of a system that gives two somewhat related
stability measures. Gain and phase margins are only calculated based on the
open loop system response. Gain and phase margin are not valid measures
on the closed loop response.
Gain and phase margin measurements serve two purposes: 1)
They ensure that your system is sufficiently damped and stable, reducing overshoot,
ringing, and other bad behaviors and 2) They ensure your system is stable enough
to deal with any unknowns in the system, such as different motors on the production
line having slightly different performance.
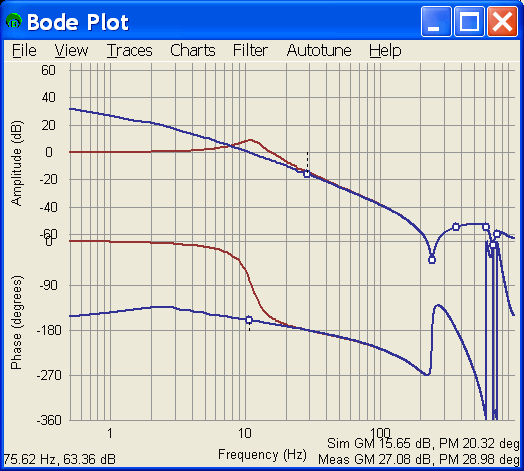
Gain Margin
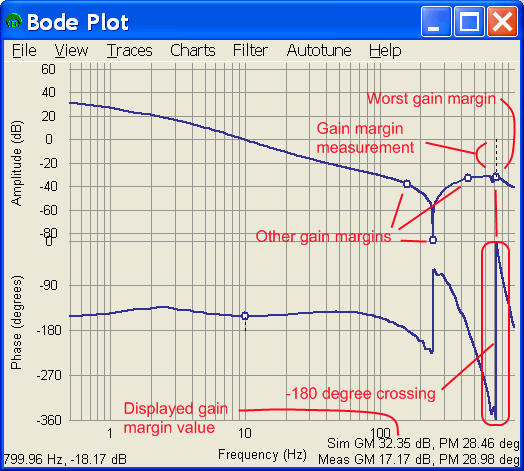
The gain margin of a system is the amount the amplitude response
is below 0 dB at the frequency the phase crosses -180 degrees. This can happen
more than once. The easiest way to deal with multiple gain margin measurements
is to concentrate on the worst one (smallest gain margin). The bode tool does
this automatically for you. It will show all gain margin measurements with a
dot and show the worst with a dot and dotted line. If the gain margin that the
bode tool chooses is not to your liking, you can put the cursor on an alternate
gain margin and use the cursor measurement to measure the gain margin. Gain
margin values are shown in the lower left of the screen for both measured and
simulated data. These concepts are shown below.
For more detail on how to understand gain and phase margins,
look here under Gain and Phase Margins.
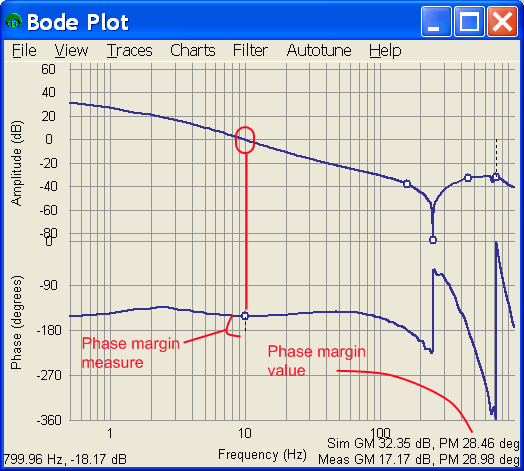
Phase Margin
Phase margin of a system is the amount that the phase of a
system is in excess of -180 degrees at the frequency where the open loop amplitude
crosses 0 dB. This can happen more than once. The easiest way to deal with multiple
phase margin measurements is to concentrate on the worst one (smallest phase
margin). The bode tool does this automatically for you. It will show all phase
margin measurements with a dot and show the worst with a dot and dotted line.
If the phase margin that the bode tool chooses is not to your liking, you can
put the cursor on an alternate phase margin and use the cursor measurement to
measure the phase margin. Phase margin values are shown in the lower left of
the screen for both measured and simulated data. These concepts are shown below.
Gain Margin vs. Phase Margin
Gain margin is no better or worse than phase margin. They
are used together to describe a system. Many people want to use one or the other,
but that will lead to disappointment on the strange case where gain margin looks
good, but phase margin looks bad or vice versa.
Recommended Values of Gain and Phase Margin
A normal system would do well with a minimum of 12 dB gain
margin and 45 degrees of phase margin. If your system were very repeatible
in perfomance, you may be able to deal with slightly less gain and phase margin.
If your system had to tolerate motion components with poor tolerances, you may
want more gain and phase margins.
A single system tuned with different parameters shows the
difference that accompanies varying phase margin. Phase margin examples of 20
- 60 degrees are shown below. Note the brown (closed loop response) trace and
how it gets a peak when the phase margin is reduced. Also note that the gain
and phase margins are measured from the blue (open loop response) trace.
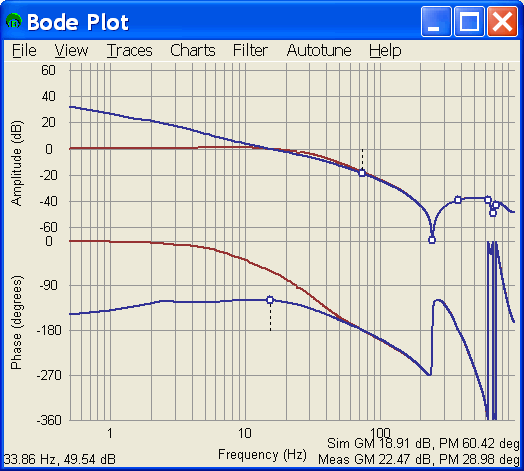
60 Degrees Phase Margin
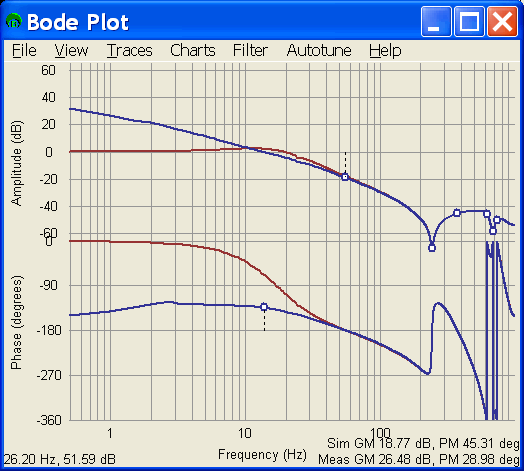
45 Degrees Phase Margin
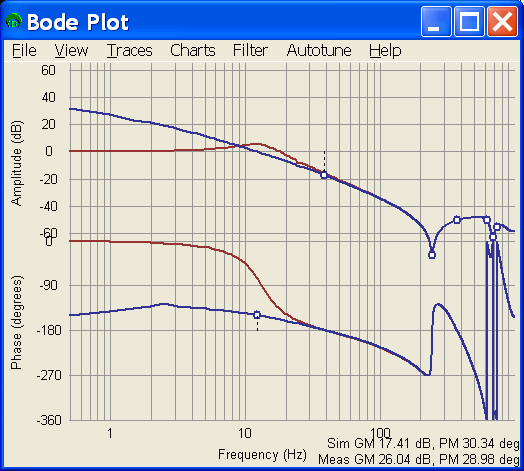
30 Degrees Phase Margin
20 Degrees Phase Margin
Gain and Phase Margin Measurement vs. Stability Measurement
Gain and phase margin:
Pro
Gain and Phase margins are the most common way to specify or measure stability
of a system. This means that if you specify stability in gain margin in
dB and phase margin in degrees, you have a very high chance of being able
to communicate effectively with another controls engineer about stability
anywhere in the world.
Con
Gain and phase margin can miss critical resonances that don't occur near
the 0 dB or -180 degree crossover frequencies.
Staiblity measure:
Pro
The stability measurement shown at the top of this page is very good at
finding the worst frequency of instability in a system. It is an automated
way of looking at the Nyquist plot, which is the most effective simple way
of looking at stability. It will not miss resonances that are not near 0
dB or -180 degrees.
Con
The stability measurement shown at the top of this page is much less common
than gain and phase margin. This makes communicating with other controls
engineers about stability more difficult.
Previous | Next
|

