Filter Simulation
The Bode Tool can simulate the response of a system
when a post filter is applied without having to retest the system
with the newly applied filter. To perform this type of simulation,
follow the procedure below.
Note: Filter simulation is not supported with MechaWare.
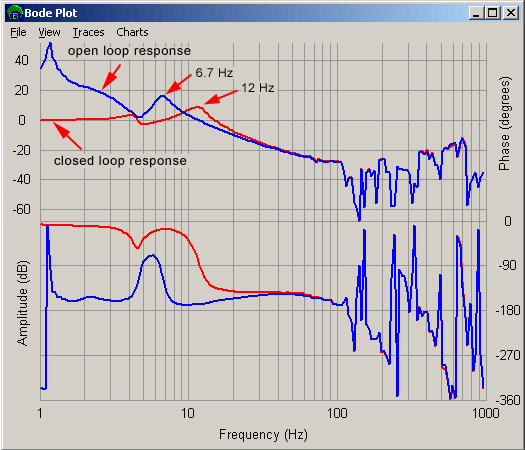
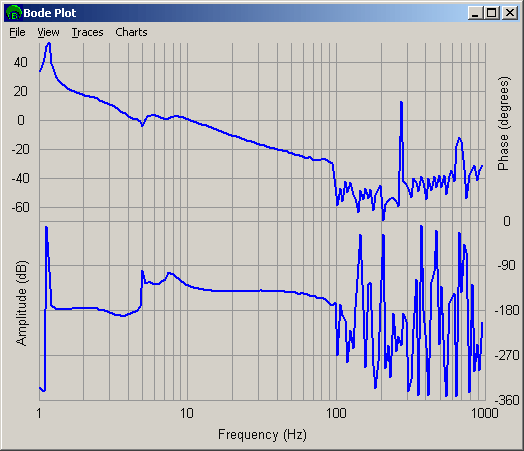
Step 1 - Get the frequency response
of the system
Here is a system with a load that resonates at
6.7 Hz with no post filter. The closed loop response is in red,
with the open loop response in blue. The same system will be used
for each step in this procedure.
We will use the open loop data to apply the filters
and verify at the end that the closed loop response is what we desire.
Notice that the resonance appears to be at ~12 Hz in the closed
loop response, while it is at 6.7 Hz in the open loop response.
The post filters are applied to the open loop
system, so we will use the open loop resonance frequency. This is
normal.
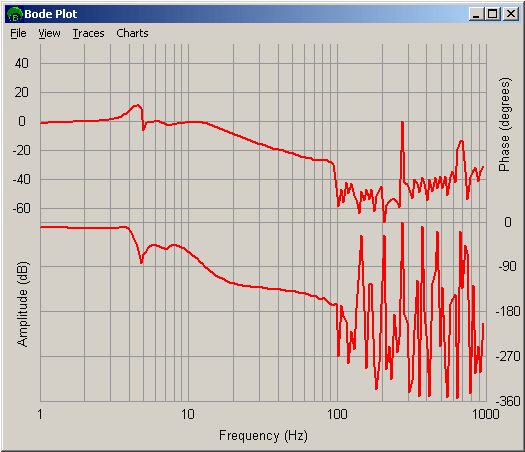
Step 2 - Simulate the open loop response
Turn off the axis to be tested and apply the desired
filter to the axis being tested. We will use a resonantor at 6.7
Hz in this example.
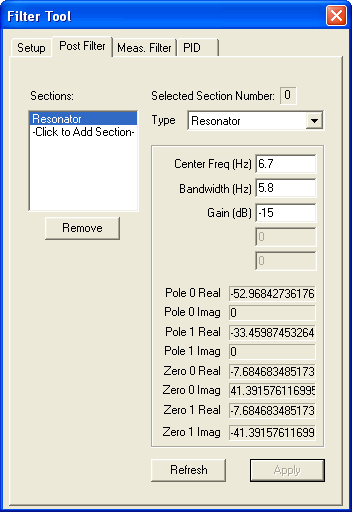
Once the filter is applied, click on View -> Refresh to
get the current filter data from the controller and display the
filtered and unfiltered open loop, and filter traces from the Traces
menu item.
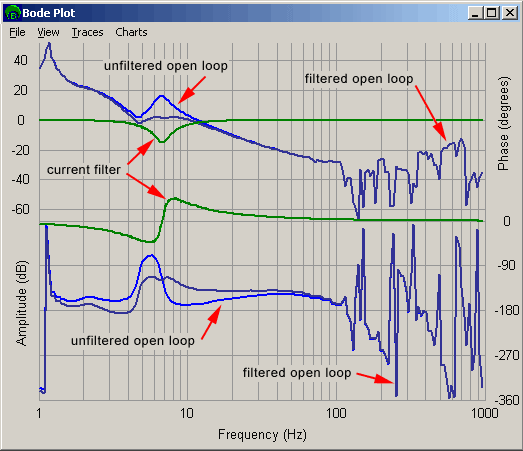
You can see that the resonance is largely eliminated.
You can update the post filter as many times as you want, clicking
on View -> Refresh to simulate the updated post filter. When the results are satisfactory,
enable the drive and make some moves to make sure that the stage
is still stable. If it is stable, proceed to the next step.
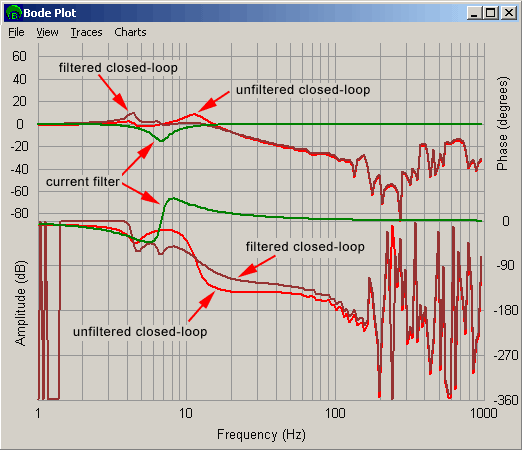
Step 3 - Simulate the closed loop
response
Change the traces to the filtered and unfiltered
closed loop, as well as the filter traces in the traces menu to
verify the closed loop response. Repeat the filter and go back to
step 2 if needed.
Step 4 - Verify the open loop response
After simulating the filter, retest the system
to verify that the simulated system accurately represents the actual
system. When simulating a filter, only use the unfiltered output,
as the simulated filter trace takes the tested data and simulates
the filter, effectively applying the filter twice (once while testing,
once while simulating). The plot shown is the open loop response
after the resonator has been applied. Comparing the response to
the original data shows a good correlation between simulated filter
response and actual filter response.
Step 5 - Verify the closed loop
response
After getting the closed loop response where you
want it, check the closed loop response and compare it to the simulated
closed loop system. If the result is too different from the simulated
result, make a change to the filter and interate until the results
are acceptably close to the intended results.
Previous | Next

