|
|
| . |
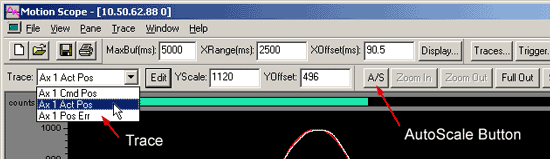
Trace and AutoScale Menu Items
Trace – The Trace field lists all currently plotted signal data using a pull-down menu. Y-axis scaling applies only to data currently selected from the Trace field. NOTE: You may also select traces by clicking on them with the right mouse button. The color of the selected trace can be toggled by clicking the left and right mouse buttons anywhere within the pane. AutoScale button – Automatically scales the vertical, Y-axis of the display pane according to the range of data points plotted within the space afforded by the user-sized window. Selection of this menu item disables the YScale and YOffset fields (see the "YScale and YOffset Fields" section). To manually scale other traces, go to the Manual Scaling section.
|
|||||||||||
| | | Copyright © 2001-2009 Motion Engineering |