|
|
| . |
Mechanical ResonanceCalculating the Resonance Frequencies in a Servo System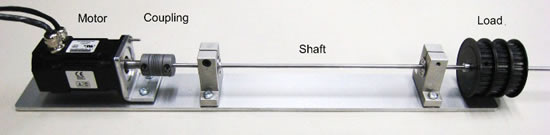 To demonstrate how mechanical resonance affects a servo system, we assembled a test system consisting of an XMP-PCI SynqNet motion controller, an S200 Drive, an AKM-11E motor, a Heli-cal coupling, a 400mm long & 4mm diameter steel shaft, and three carbon steel pulleys. The three pulleys are placed adjacent to one another, forming a single load 300mm away from the motor. Inertia and damping constants for this system are shown below. Jmotor = 2.50 x 10⁻⁶ kgm2 Kshaft = 6.45 Nm/rad
The plant frequency response can be calculated so that we can use this data to predict the achieved performance in closed loop mode. A motor with a mass load attached through a spring is a common situation that occurs in real servo systems. The calculations below show how to identify the nodes and anti-nodes in a two body servo system. FR – Node center frequency JL = 3 x Jwheel + Jshaft = 1.73 x 10⁻⁴ kgm2 Using Bode Tool, we find the measured FR and FAR frequencies to be 200 Hz and 25 Hz, respectively. Our calculated values are very accurate given the correct inertia and damping parameters. For an additional reference regarding mechanical resonance and other topics in servo control, please refer to Control Systems Design Guide (3rd Ed.) by George Ellis. Servo System Tuning with Mechanical ResonanceThe following tutorial requires basic knowledge of Bode Tool and frequency shaping concepts. Below is the Bode Tool plot of our system. We have two resonance frequencies, FR at 200 Hz and FAR at 25 Hz. We first enable post filters by setting Kp to 1.
The node resonance at 200 Hz affects system stability and reduced in order to achieve any significant bandwidth. Setting a resonator with the center frequency at 200 Hz, bandwidth at 45 Hz, and -22 dB gain effectively cancels this peak (shown below).
After canceling out the resonance peak, we are ready to apply a lead/lag filter to provide dampening to the system. Below is the Bode plot of our system after applying a lead/lag filter centered at 22 Hz with low frequency gain -47 dB and high frequency gain -25 dB. These gains provide a stable closed loop (red trace) response. The center frequency was shifted to align the filter phase bump (green trace) with zero crossing frequency. The underdampened peak will be addressed in the next step.
There is an underdampened peak in the simulated closed loop (red trace) response at about 200 Hz. The image below shows the closed loop response of our system after applying a resonator centered at 217 Hz with 300 Hz of bandwidth and -10 dB of gain.
The system still has a visible anti-node at 25 Hz. This means that the load (output) is not moving much relative to the motor (input). This has effects on our system but not in a way that causes a problem. Back | Back to Servo Tuning Documentation
|
| | | Copyright © 2001-2021 Motion Engineering |